For information on access fees, policies and getting started at the CMI, see the CMI Access Page.
MicroScale Thermophoresis (MST)
For information on access fees, policies and getting started at the CMI, see the CMI Access Page.
MST at the CMI
MicroScale Thermophoresis (MST) is an immobilization-free technology for measuring biomolecular interactions. The MST instrument detects the motion of fluorescent molecules along a microscopic temperature gradient, which reflects changes in the molecular hydration shell, charge, or size. Since one or all of these parameters will change with virtually every binding event, a wide range of biomolecules can be measured, from ions and small molecule fragments to large macromolecular complexes, in small volumes (~20 μl), in a wide range of standard buffers and complex mixtures such as liposomes, detergent, serum, and cell lysates.
The CMI has a Monolith NT.115pico from NanoTemper Technologies.
Monolith NT.115pico Instrument Detectors
Pico RED detector
- excitation wavelength: 600-650 nm
- eg. AlexaFluor647, NT647, Cy5
- fluorophore concentration ≥ 50 pM
- Kd range: pM - mM
Nano BLUE detector
- excitation wavelength 460-490 nm
- eg. fluorescein, AlexaFluor488, NT495, GFP
- fluorphore concentration ≥ 5 nM
- Kd range: nM - mM
Key Features
- fast measurement: Kd in about 10 min
- wide Kd range from pM/nM to mM range
- low sample consumption: sample volume (<10 µl per concentration)
- immobilization free, in-solution measurements
- measurements in complex mixtures (cell lysates, serum, detergents, liposomes)
- wide size range for interactants (from ions to MDa complexes)
MST Theory
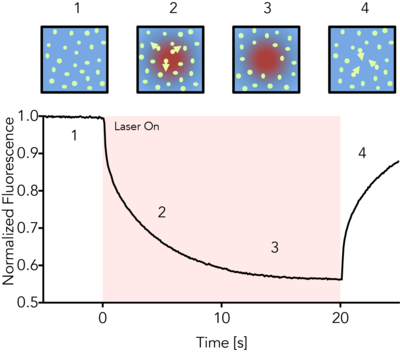
MicroScale Thermophoresis (MST) detects the motion of fluorescent molecules along a microscopic temperature gradient, which reflects changes in the molecular hydration shell, charge or size. A local temperature difference ΔT, induced by an infrared laser, leads to a local change in molecule concentration (depletion or enrichment), quantified by the Soret coefficient ST, chot/ccold=exp(-STΔT). This directed movement of molecules along a temperature gradient is termed "thermophoresis". Changes in the thermophoresis of a fixed concentration of fluorescent molecules in a constant buffer reflect changes in the size, charge or solvation entropy of the fluorescent molecules due to binding of the non-fluorescent partner (the titrant). Measuring this behavior at different concentrations of titrant allow quantification of the binding and determination of affinity.
Data Files - About CMI Data Files
Users are responsible for storage of all raw and processed data collected at the CMI.
- Users should have a plan to copy or transfer all raw and process data to their own local or cloud storage system.
- While the CMI allows temporary local storage of CMI User data on the instrument computer, we make no guarantees on the security or long-term availability of any data at the CMI.
- For most (but not all) CMI technologies, the raw data files and recommended readable exports are relatively small and can be readily transferred electronically.
- See specific instruments for exceptions and for details about the software, data file types and recommended data exports.
Data Sharing:
- Currently, a Generalist Repository is the recommended data repository for most CMI data types, as stable specialist data repositories have not been established.
Data Files - MST - Monolith NT.115pico
| Technology | Microscale Thermophoresis (MST) | ||
| Instrument | Nanotemper Monolith NT.115pico | ||
| Recommended Repository | Generalist Repository | ||
| Software Type | Data Collection | ||
| Current Version | MO.Control, Version 1.6.1 | ||
| Data Files (Type, ~size) | experiment file | .moc | 1-5 MB/experiment |
| raw data | .xslx | 10-25 MB/file | |
| Software Type | Data Analysis | ||
| Current Version | MO.Affinity Analysis, Version 2.3 | ||
| Data Files (Type, ~size) | analysis file | .nta | 1 MB/experiment |
| Readable Exports | processed data | .xslx | 10-25 KB/file |
| pdf report | 1 MB/report | ||
CMI Monolith MST Getting Started Guide
MicroScale Thermophoresis technology, from NanoTemper Technologies
Monolith NT.115 instrument product page, from NanoTemper Technologies
Required Supplies
- fluorescent target sample and non-fluorescent ligand sample and matched buffer
- MST capillaries (see below)
- 0.2 ml tubes for sample preparation (provided by CMI)
- pipetors and tips for liquid handing
NanoTemper Supplies
MST Capillaries
- Monolith NT.115 Standard Treated Capillaries, MO-K022 (available from the CMI, at cost)
- Monolith NT.115 MST Premium Coated Capillaries, MO-K025 (available from the CMI, at cost)
Labeling Kits (optional)
- NanoTemper Protein Labeling Kit RED-NHS 2nd Generation (Amine Reactive), MO-L011
- NanoTemper Protein Labeling Kit RED-MALEIMIDE 2nd Generation (Cys Reactive). MO-L014
- NanoTemper His-Tag Labeling Kit RED-tris-NTA 2nd Generation, MO-L018
Assay Buffers
- Many buffers are compatible with MST. It’s usually a good idea to start with a buffer system in which your proteins are well behaved.
- Addition of 0.05% Tween 20 or other detergent is usually required to prevent sticking of proteins to the capillaries.
- Each capillary should be prepared with identically matched buffer.
- Assay buffer (with detergent) is used to dilute the fluorescent molecule to 2X.
- Ligand buffer is used to dilute the ligand and should match the highest concentration of ligand
- 0.5-1 mg/ml BSA can also be used to minimize non-specific binding.
- Buffer cannot be opaque.
- High viscosity samples may be hard to fill (up to 10% glycerol is fine).
Samples
- All MST experiments are setup with one fluorescently-labeled molecule (the Target) at a fixed concentration mixed with various concentrations of a non-fluorescent molecule (the Ligand).
-
Concentration should be accurately measured
- Errors in Target concentration can affect fluorescent signal and may affect the fit
- Errors in the Ligand concentration will directly translate to errors in the KD
-
Protein aggregates will interfere with MST
- Filter or centrifuge samples before use.
- Assess protein heterogeneity via light scattering.
- Purify protein samples with soluble aggregates by size-exclusion chromatography.
Target Sample (the fluorescent molecule)
- ~200 µL/titration at >2X working concentration
- 5-20 µM unlabeled protein, if using a chemical labeling kit
-
RED detector:
- Stock concentration of labeled Target: > 10 nM
- Recommended working concentration: 5 nM (for KD > nM)
- Minimal working concentration: ≥ 50 pM (used for KD in pM range)
-
BLUE detector:
- Stock concentration of labeled Target: > 20 nM
- Recommended working concentration: 20 nM
- Minimal working concentration: ≥ 5 nM
Ligand Sample (the non-fluorescent binding partner)
- ~ 20 µL/titration, at 2X working concentration (bring the highest stock concentration available for an unknown KD)
- Recommended stock concentration ≥ 100X the expected KD
- Recommended working concentration ≥ 50X KD