
|
|
Carl-Fredrik Westin, PhD Core PI |
Our Publications
The goal of the Microstructure Imaging Core is to pursue technological developments that improve current understanding of white matter anatomy and pathology in the brain. Given the small dimension of the neural pathways in relation to current imaging resolution, these technologies are vital to analyzing and visualizing the neural anatomy in normal and diseased states. Our current clinical objective is to analyze abnormalities in white matter architecture that underlie schizophrenia by using techniques in diffusion magnetic resonance imaging (dMRI) and post-process imaging. The expectation is that new knowledge acquired from these studies not only will benefit the understanding and treatment of schizophrenia, but also a broad range of other white matter diseases. The work of this core is organized around the following themes:
- Development of Microstructural Imaging Biomarkers
- Development of Personalized Anatomical Analysis Methods
- Population Statistics and Patient-Specific Diagnosis
The objective of this research is to develop and implement quantitative measures from diffusion MRI (dMRI). Methods to be explored include multi-shell dMRI to determine free vs. multi-compartmental or restricted diffusion; compressed sensing (CS) in conjunction with MRS to allow detection of microstructural metabolic change within the tissue; and double-pulsed field gradient dMRI (double-PFG) to provide previously unavailable diffusion properties that can be mapped into families of new types of geometric and tissue-specific parameters. Software for measuring the proposed biomarkers will be developed and tested.
Featured Technologies
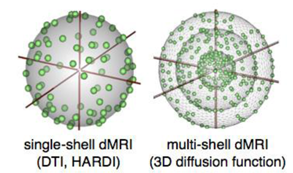 Standard dMRI (left) allows measurement of the angular distribution of the diffusion function; whereas the radial part of this function measured with multi-shell dMRI (right) reflects the type of diffusion observed (free vs. multicompartmental, or restricted).
 Traditional diffusion MRI (single-PFG) would only provide the first pair of gradients, G1,G1. Increased microstructural detail (G2, G2) can be measured with the double-PFG diffusion sequence.
Diffusion MRI in 3D Slicer

Image legend: Diffusion MRI data for neurosurgical planning. The tractography region of interest (ROI) is depicted by the box placed around the tumor (in green) in the frontal lobe. The ROI is also visualized with rectangles in the slice views below. Tracts are then created based on the principal diffusion directions, which are color coded (bottom). Diffusion ellipsoids are shown along the tract to visualize the shape of the local diffusion.
The 3D Slicer (or simply Slicer) software was initially developed as a joint effort by the Surgical Planning Laboratory of Brigham and Women's Hospital and the Medical Vision Group of the MIT-based Computer Science and Artificial Intelligence Laboratory (CSAIL). The goal was to create an interactive, open source software platform for biomedical research. The program has evolved into a national platform supported by a variety of federal funding sources. This versatile research environment has resulted in a wide array of functionality and supports a variety of medical imaging projects.
Slicer is a "point and click" end-user application. It is used as a vehicle for delivering algorithms to computer scientists, biomedical researchers, and clinical investigators. Slicer is distributed under an open source license without a reciprocity requirement and without restrictions on use. For a sampling of the portfolio of applications, please see the Slicer Community page. 3D Slicer consists of over a million lines of code, mostly C++. This massive software development effort was enabled by the participation of several large-scale NIH-funded efforts, including the National Alliance for Medical Image Computing (NA-MIC), Neuroimage Analysis Center (NAC), Biomedical Informatics Research Network (BIRN), Center for Integration of Medicine and Innovative Technology (CIMIT), and National Center for Image Guided Therapy (NCIGT) communities. Federal funding sources include the National Center for Research Resources (NCRR), National Institute of Biomedical Imaging and Bioengineering (NIBIB), NIH Roadmap, National Cancer Institute (NCI), National Science Foundation (NSF), and the Department of Defense (DOD) among others.
DTMRI is a module in the 3D Slicer collection used for interactive visualization of diffusion tensor MRI (DT-MRI, or DTI). A cross-platform end user application used for analyzing and visualizing medical images, Slicer consists of a collection of Open Source libraries for developing and deploying new image computing technologies. It is an algorithm development platform with a powerful new Execution Model to facilitate creation of new modules. The White Matter Architecture Core has made major contributions in the diffusion MRI analysis and visualization packages in Slicer2, Slicer3, and Slicer4 (www.slicer.org).
Estimation Procedures for High Angular Resolution Diffusion MRI

The White Matter Architure Core has developed novel estimation procedures for High Angular Resolution Diffusion MRI (HARDI). Our novel method “Orientation Probability Density Transform” (OPDT) of estimating the diffusion function has received widespread attention [Tristan-Vega, 2009], [Tristan-Vega, 2010]. Compared to the popular approaches of Q-Ball imaging and the diffusion orientation transform (DOT), our formulation introduces considerably less blurring of the angular function as shown in the figure.
In our work, instead of radial projections, true angular marginalizations were computed. We showed that the Jacobian of the spherical coordinates (in this case r2) needs to be included, a crucial contribution as the transform has been calculated without the correct term since 2003. Our formulation, the OPDT, is advantageous as it has a strict probabilistic interpretation, and the correct expression introduces considerably less blurring of the angular function in comparison to other methods such as Q-Ball and DOT.
The figure shows diffusion profiles for crossing fibers with different angles reconstructed using the Q-Ball imaging (top), the diffusion orientation transform (middle), and our formulation (OPDT). Note that the OPTD method introduces considerably less blurring of the angular function, making it easier to detect the peaks of the function corresponding to the two underlying diffusion directions.
Image legend: Diffusion profiles for crossing fibers with different angles reconstructed using the Q-Ball imaging (top), the diffusion orientation transform (middle), and our formulation (OPDT).
Multiple Fiber Model Tractography

Image legend: Multiple fiber model tractography using unscented Kalman filtering. Note the additional tracts (blue) the new method finds.
The White Matter Architecture Core has developed tractography methods that can trace complex white matter regions, such as regions where there is heavy crossing and branching of the fiber tracts [Malcolm, 2009]. In this work we propose a technique to simultaneously estimate the local fiber orientations and perform multi-fiber tractography. Existing techniques estimate the local fiber orientation at each voxel independently. Consequently, there is no running knowledge of confidence in the measured signal or estimated fiber orientation. Further, to overcome noise, many algorithms use a filter as a post-processing step to obtain a smooth trajectory. Fiber tracking is formulated as a causal estimation: at each step of tracing the fiber, the current estimate of the signal is guided by the previous. The signal is modeled as a discrete mixture of Watson directional functions, and the tractography is performed within a filtering framework. Starting from a seed point, each fiber is traced to its termination using an unscented Kalman filter to simultaneously fit the signal and propagate in the most consistent direction. Despite the presence of noise and uncertainty, this provides an accurate estimate of the local structure at each point along the fiber. The Watson function was chosen since it provides a compact representation of the signal parameterized by the principal diffusion direction and a scaling parameter describing anisotropy. It also allows analytic reconstruction of the oriented diffusion function from those parameters. Using a mixture of two and three components (corresponding to two-fiber and three-fiber models) we demonstrate in synthetic experiments that this approach reduces signal reconstruction error and significantly improves the angular resolution at crossings and branchings. In vivo experiments shown in the figure examine the corpus callosum and internal capsule and confirm the ability to trace through regions known to contain such crossing and branching while providing inherent path regularization.
Tract-Based Diffusion Feature Analysis

Image legend: SLICER interface for the EM fiber clustering module.
The White Matter Architecture Core has also worked on developing an automatic method that we call tract-based morphometry, or TBM, for measurement and analysis of diffusion MRI data along white matter fiber tracts [O'Donnell, 2009]. Using subject-specific tractography bundle segmentations, the method generates an arc length parameterization of the bundle with point correspondences across all fibers and all subjects, allowing tract-based measurement and analysis. In this work the team presents a quantitative comparison of fiber coordinate systems from the literature and we introduce an improved optimal match method that reduces spatial distortion and improves intra- and inter-subject variability of FA measurements.
The team proposed a method for generating arc length correspondences across hemispheres, enabling a TBM study of interhemispheric diffusion asymmetries in the arcuate fasciculus (AF) and cingulum bundle (CB). The results of this study demonstrate that TBM can detect differences that may not be found by measuring means of scalar invariants in entire tracts, such as the mean diffusivity (MD) differences found in AF. TBM results are reported of higher fractional anisotropy (FA) in the left hemisphere in AF (caused primarily by lower λ3, the smallest eigenvalue of the diffusion tensor, in the left AF), and higher left hemisphere FA in CB (related to higher λ1, the largest eigenvalue of the diffusion tensor, in the left CB). By mapping the significance levels onto the tractography trajectories for each structure, the anatomical locations of the interhemispheric differences are shown. The TBM approach brings analysis of DTI data into the clinically and neuroanatomically relevant framework of the tract anatomy. The team has also developed tools for tract-based analysis in 3D Slicer. As shown in the figure, the new command line module for EM clustering developed in collaboration with GE Research (Jim Miller) makes anatomical grouping and quantitative analysis of diffusion measures available to the research community. The team has also created an on-line tutorial for this module.
Asymmetry of White Matter Tract

Image legend: Our white matter clustering method defines homologous anatomy across subjects (left). It has been validated by comparison to interactive tract selection (middle). The clustering method has been used in several studies of schizophrenia (SZ), e.g., to define callosal subdivisions, detecting reduced FA in the anterior corpus callosum in SZ (right).
The team has proposed a new method for studying the asymmetry of white matter tracts in the entire brain. This approach has been applied to a preliminary study of normal subjects across the handedness spectrum [O’Donnell, 2010]. The quantification of brain asymmetries may provide biomarkers for presurgical localization of language function and can improve our understanding of neural structure-function relationships in health and disease. Methods for quantifying white matter asymmetry using diffusion MRI tractography have thus far been based on comparing numbers of fibers or volumes of a single fiber tract across hemispheres. The team further proposes a generalization of such methods, where the “number of fibers” laterality measurement is extended to the entire brain using a soft fiber comparison metric. The distribution of fiber laterality indices over the whole brain is summarized in a histogram, and defines properties of the distribution using its skewness, median, and inter-quartile range. The whole-brain fiber laterality histogram can be measured in an exploratory fashion without hypothesizing asymmetries only in particular structures. The team has demonstrated an overall difference in white matter asymmetry in consistent- and inconsistent-handers: the skewness of the fiber laterality histogram is significantly different across handedness groups. The figure shows fiber laterality indices and fiber laterality histograms in example subjects from each handedness group.
Research Highlights

Figure 1: Q-space trajectory imaging for multidimensional diffusion MRI of the human brain. This visualization of four proposed QTI measures demonstrates how the measures would change in eight illustrative synthetic macrodomains (voxels). Note that these measures intuitively separate size, shape, and orientation coherence, as well as provide the traditional measures of macroscopic anisotropy. The microstructure measures proposed from QTI can disambiguate complex microenvironments that are indistinguishable using today’s standard single diffusion encoding (SDE) methods. For example, the macroscopic anisotropy (FA) of all diffusion tensor distributions (DTDs) found in the bottom row is very low, while the microscopic anisotropy (μFA) reflects the anisotropy of the individual micro-environments [Westin, 2016].

Figure 2: Constrained optimization of gradient waveforms for generalized diffusion encoding. The team provided a solution to the problem of constrained optimization of gradient waveforms imposed by clinical hardware, while maximizing the diffusion encoding strength afforded by QTI, by solving a constrained optimization problem that accommodates constraints on maximum gradient amplitude, slew rate, coil heating and positioning of radio frequency pulses. The method's efficacy and flexibility is demonstrated both experimentally and by comparison with previous work on optimization of isotropic diffusion sequences. In this figure, raw diffusion weighted images are shown on an axial slice through the corpus callosum in a healthy volunteer. The encoding strength is b=2000 s/mm2 in both images. The measured signal is markedly higher in the images encoded with the optimized waveform (A, echo time 116 ms) compared to the qMAS waveform (B, echo time 170 ms). The histogram shows the distribution of voxelwise SNR from brain tissue located within the imaging slab. There is a clear tendency towards higher SNR for the optimized waveform, due to the shorter echo time [Sjölund, 2015].

Figure 3A: Sampling strategies and compressed sensing for high spatial resolution dMRI. T1 weighted MRI image with a yellow inset showing the corresponding inset of the colored-by-orientation DTI images. The low resolution images have 1.83 mm3 isotropic voxels, while the interpolated DTI and the super resolution data set have 0.93 mm3 isotropic voxels. The yellow arrows point out the fine details in the super resolution results that are missing in the low resolution and the interpolated results.

Figure 3B: Sampling strategies and compressed sensing for high spatial resolution dMRI. B. Left: T1 weighted MRI images with a yellow inset indicating the anatomical area of the DTI images with color-coded tensor glyphs visualizing the local white matter fiber orientation. Middle: the low resolution data set (with 1.83 mm3 isotropic voxels). Right: The result of the proposed compressed sensing super resolution method (with 0.93 mm3 isotropic voxels). The rectangle shows the glyphs in a gray-matter region that were missing in the low resolution results [Radmanesh, 2015].
 Figure 4: White matter segmentation using clustering for traumatic brain injury. Results from clustering the result of whole brain white matter tractography. Left: 650 color-coded clusters with a distinct color for each segmented tract segment. Right: Example of one selected cluster with the corresponding tract from the control group and the player group. By O'Donnell et al. (preliminary unpublished findings).]

Figure 5: Using abnormal white matter connections between medial frontal regions to predict symptoms in patients with first episode schizophrenia. Scatter plots of mean fractional anisotropy for first episode schizophrenia and the healthy control group. Abbreviations: OFC = orbitofrontal cortex; ACC = anterior cingulate cortex; SZ = schizophrenia group; HC = healthy control group. *p < .001. ]
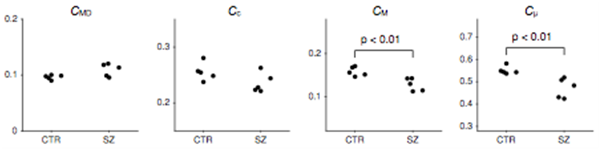
Figure 6: New microscopic measures derived from QTI applied to schizophrenia population. Comparison of normalized measures in schizophrenia patients (SZ) and healthy controls (CTR). The CMD, CM and Cμ averaged across the white matter were all significantly reduced in the schizophrenia group. Changes in Cc were not found to be significant between the groups. Significance was tested using the Wilcoxon rank-sum U-test. ]
PROGRESS UNDER AIM 1: DEVELOPMENT OF MICROSTRUCTURAL IMAGING BIOMARKERS
Dr. Westin’s team reported progress in four projects designed to further the goals of aim 1.
Q-space trajectory imaging for multidimensional diffusion MRI of the human brain (FIGURE 1). The team has developed a framework called q-space trajectory imaging (QTI), which uses gradient waveforms to probe trajectories in q-space. In contrast to single diffusion encoding (SDE) sequences that probe a single point in q-space, a single QTI measurement encodes multiple diffusion directions (Figure 1). The team has shown that measuring a family of trajectories introduces higher-order (multi-dimensional) correlations, which permit separate quantification of microstructural properties that are intrinsically entangled in traditional SDE. Within this framework the microstructural properties, mathematically expressed in terms of variability in size, shape, and orientation, are extracted from a diffusion tensor distribution model representing a mixture of distinct neuronal tissue micro-environments, such as neurites, cellular domains, and extracellular spaces [Westin, 2016].
Characterizing magnetic resonance signal decay using the path integral approach. The influence of Gaussian diffusion on the magnetic resonance signal is determined by the apparent diffusion coefficient (ADC) and tensor of the diffusing fluid as well as the gradient waveform applied to sensitize the signal to diffusion. Estimations of the ADC and the diffusion tensor from diffusion-weighted acquisitions necessitate computations of, respectively, the b-value and b-matrix associated with the employed pulse sequence. The team has established the relationship between these quantities and the gradient waveform by expressing the problem as a path integral, which is then explicitly evaluated. Further, the team has shown that these important quantities can be conveniently computed for any gradient waveform using a simple algorithm that requires a few lines of code. With this representation, the new technique complements the multiple correlation function method commonly used to compute the effects of restricted diffusion. It also provides a consistent and convenient framework for studies that aim to infer the microstructural features. To understand the meaning of MR signals, it is important, theoretically, to relate the applied waveform to an expected MR signal for a given structure or geometry. This has been studied extensively for single diffusion encoding (SDE). During the past year the team began this analysis for QTI by presenting the initial steps towards a general analytical framework with which one can derive explicit relationships for MR signal decay for a general time-dependent gradient waveform. Unlike earlier derivations, this one is based on path integrals and is more intuitive as it is based solely on probabilistic notions rather than the Bloch-Torrey equation. The team plans to extend this framework to develop efficient numerical methods for Gaussian and non-Gaussian diffusion models.
Constrained optimization of gradient waveforms for generalized diffusion encoding (FIGURE 2). The conventional diffusion encoding sequence, i.e., the single pulsed field gradient (PFG), has recently been challenged as more general gradient waveforms have been introduced, such as q-space trajectory imaging (QTI), which generalizes the scalar b-value to a tensor valued entity. To design gradient waveforms with specific features while taking full advantage of clinical scanner capabilities, it is imperative to respect the constraints imposed by the hardware while maximizing the diffusion encoding strength. The team has provided a tool that achieves this goal by solving a constrained optimization problem to accommodate constraints on maximum gradient amplitude, slew rate, coil heating, and positioning of radiofrequency pulses. The efficacy and flexibility of this method is demonstrated both experimentally and by comparison with previous work on optimization of isotropic diffusion sequences. Q-space trajectory imaging enables diffusion encoding with a general measurement tensor B. Although the “b-matrix” concept is well established and can be found in standard textbooks on diffusion NMR and MRI, the characterization of the b-matrix using double-PFG and more general gradient waveform diffusion MRI is novel and different. The team showed that it is possible to perform diffusion encoding imaging of the human brain (FIGURE 2) with arbitrary q-space trajectories while maintaining good SNR to generalize the concept that b-values can enable new types of measurements not available with single-PFG.
Sampling strategies and compressed sensing for high spatial resolution dMRI (FIGURES 3A, 3B). Compressed sensing (CS) is used in signal processing to reconstruct a signal from very few measurements or samples. CS has received significant attention in the MRI community for its ability to reconstruct an image with fewer data points, thereby reducing scan time. During the past year the team developed a novel sampling and reconstruction scheme for obtaining high spatial resolution dMRI images using multiple low resolution images that effectively reduces acquisition time while improving signal-to-noise (SNR) ratio. The proposed method, called compressed-sensing super-resolution reconstruction, uses multiple overlapping thick-slice dMRI volumes that are under-sampled in q-space to reconstruct diffusion signals with complex orientations. The proposed method combines the twin concepts of compressed sensing and super-resolution to model the diffusion signal (at a given b-value) using spherical ridgelets with total-variation regularization to account for signal correlation in neighboring voxels. The performance of the proposed method is quantitatively evaluated on several in vivo human data sets. The experimental results demonstrate that the proposed method can be used for reconstructing sub-millimeter super-resolution dMRI data with very good data fidelity in a clinically feasible acquisition time.
PROGRESS UNDER AIM 2: DEVELOPMENT OF PERSONALIZED ANATOMICAL ANALYSIS METHODS
Dr. Westin’s team further refined their white matter tractography clustering method to permit automated measurement of white matter regions in subjects with traumatic brain injury.
White matter segmentation using clustering for traumatic brain injury (FIGURE 4). The team continued to develop a white matter atlas creation method for the purpose of studying subjects with traumatic brain injury (TBI). The method learns a model of the common white matter structures present in a group of subjects. Based on group spectral clustering of tractography, the method discovers structures corresponding to expected white matter anatomy such as the corpus callosum, uncinate fasciculus, cingulum bundles, arcuate fasciculus, and corona radiata. The white matter clusters are augmented with expert anatomical labels and stored in a new type of atlas called a high-dimensional white matter atlas. The automatic tractography segmentation identifies corresponding white matter regions across hemispheres and across subjects, thus enabling group comparison of white matter anatomy. This preliminary study analyzed the white matter structures of 63 retired National Football League (NFL) players vs 26 healthy age-matched (ages 45-69) controls. The clustering method enabled automated measurement of 650 white matter regions in each subject, with 7% of the clusters showing lower fractional anisotropy (FA) in the player group.
PROGRESS UNDER AIM 3: APPLICATION TO TBI: POPULATION STATISTICS AND PATIENT-SPECIFIC DIAGNOSIS
Dr. Westin’s team developed new QTI analysis methods and applied them to population studies in schizophrenia.
Application of analysis methods to population studies in schizophrenia (FIGURE 5). The team studied abnormal white matter connections between medial frontal regions to determine their value in predicting symptoms in patients with first episode schizophrenia. Clinically, a majority of patients with early stages of schizophrenia, a population frequently referred to as first episode schizophrenia (FESZ), demonstrate positive symptoms such as hallucinations and delusions. Negative symptoms also exist in the early stage of the illness, although they are observed less frequently in FESZ than in chronic schizophrenia populations. It has been suggested that the medial orbitofrontal cortex (mOFC) and rostral part of anterior cingulate cortex (rACC) are involved in the neural network of salience and emotional processing and associated with specific clinical symptoms of schizophrenia. Considering the schizophrenia dysconnectivity hypothesis, the connectivity abnormalities between mOFC and rACC might be associated with clinical characteristics in first episode schizophrenia patients (Figure 5). Diffusion tensor imaging (DTI) is a promising method for characterizing microstructural changes or differences with neuropathology and treatment. Diffusion MRI (dMRI) encodes information on translational displacements of water on the micrometer scale. Thus, the dMRI signal is an excellent probe for microstructural geometries in tissue such as the human brain. In dMRI, each millimeter-scale measurement contains an aggregate of information from a multitude of microscopic environments (microenvironments). The diffusion tensor characterizes the magnitude, anisotropy, and orientation of the diffusion tensor to reveal the relationships between DTI measures and white matter pathologic features (ischemia, myelination, axonal damage, inflammation, and edema). FA is highly sensitive to microstrutural changes, but not very specific as to the orientation of the change. The main findings of this study include a reduction of FA and significant increases in radial diffusivity (RD) and Trace (magnitude) without significant changes in axial diffusivity (AD) in white matter fibers connecting the mOFC and the rACC, suggesting that dismyelination might affect normal connectivity in this region in patients with FESZ. In addition, FA reduction in the fibers connecting the posterior mOFC and rACC was related to the severity of delusions and emotion-related negative symptoms in FESZ, implying an association between posterior mOFC- rACC disconnectivity and the psychopathology of early stage of schizophrenia.
The team also derived new microscopic measures based on q-trajectory imaging (QTI) and applied them to a schizophrenia population (FIGURE 6). Parameter maps derived from QTI were compared between patients with chronic schizophrenia and healthy controls. Nine of the 14 parameters investigated showed differences between groups. The ability to measure and model the distribution of diffusion tensors, rather than a quantity that has already been averaged within a voxel, has the potential to provide a powerful paradigm for studying complex tissue architecture. Following a new approach, the team separated the bulk and shear variances into measures that are more intuitively meaningful, with the goal of separating size, shape, and orientation coherence. The measures were normalized and ranged between 0 and 1. Normalizing the bulk variance (VMD) yields a natural size variation parameter, CMD. Normalizing the shear variance is more challenging because it is affected by both the shape of the microenvironment and its orientation coherence (or dispersion). Using this approach, the team derived a measure of shape, Cμ, related to μFA and a separate measure of microscopic orientation coherence, Cc, related to previously presented order parameters (Figure 6). As expected, the schizophrenia patients showed elevated mean diffusivity (MD) in the white matter. Interestingly, this increase was matched by an increase in VMD. The increase cannot be explained by a homogeneous increase in the local mean diffusivity, rather it can be explained by an increase in the fraction of free water. This finding suggests that increased extracellular water, e.g., due to chronic neuroinflammatory processes or atrophy, is the primary mechanism underlying white matter diffusion changes in this cohort of patients with chronic schizophrenia. However, while reduced Cμ was also observed, Cc in the schizophrenia patients was unaltered, which could indicate axonal degradation at a microscopic level. Further studies with larger sample sizes are needed to confirm these findings. The current results, obtained by averaging throughout the entire white matter, do not lend themselves to the precise interpretation of the newly proposed measures in comparison with more traditional SDE measures. It may be more meaningful to study localized changes in both the white matter and the gray matter, and then to assess these results with analogy to simple prototype distributions.